The Revisionist Is History: A Deep Dive into Rigged Numbers, Political Theater, and the Cracking Foundations of the U.S. Economy
A very Big Think

Happy Saturday team,
After the jobs report last night you knew we were going to take a deep dive into the political theater of the BLS right?
Well, we did 😜 so buckle up, grab your espresso, and let's deep dive on in.
Introduction: The Jobs Report That Broke the Thermometer
It was a Friday morning in August, the kind of sleepy summer day on Wall Street when traders would rather be anywhere else. But on August 1, 2025, they were glued to their screens, waiting for the monthly ritual: the U.S. employment report. The market was already on edge, jittery from a fresh wave of tariff threats and whispers that the economy’s post-pandemic sugar high was finally wearing off. At 8:30 a.m. ET, the number dropped.
And it was a dud.
The Bureau of Labor Statistics (BLS) reported that the U.S. economy had added a paltry 73,000 nonfarm payroll jobs in July. This was a significant miss from the 100,000+ consensus forecasts and a clear sign of a cooling labor market. The unemployment rate ticked up to 4.2%. But that wasn't the real story. The real story, as is so often the case, was buried in the footnotes—the place where truth goes to die, or in this case, to be quietly confessed.
The real story was the revisions. The job numbers for the previous two months, May and June, were not just revised; they were eviscerated. The initial report for May had shown a gain of 144,000 jobs. For June, it was 147,000. Mediocre, but fine. The numbers you tell your parents when they ask how the economy is doing. But on this Friday, the BLS admitted that May’s gain was actually just 19,000. June’s was a rounding error at 14,000. In total, a staggering 258,000 jobs that were thought to exist in the prior two months simply vanished into the statistical ether. This was the steepest two-month downward revision since April 2020, when the world was literally shutting down. The three-month average job growth, a measure used to smooth out monthly noise, was now a pathetic 35,000.
This wasn't a revision. It was a confession. It was the government’s prim statistical agency admitting that its initial portrait of the economy wasn't just a little blurry; it was a completely different picture. The market, which can be slow on the uptake but is ruthlessly quick to price in fear, understood immediately. The Dow Jones Industrial Average plunged more than 500 points, Treasury yields cratered as traders frantically bid up the odds of a September Fed rate cut from under 40% to over 80% in a matter of hours.
The financial explosion was quickly followed by a political one. Within hours, President Donald Trump, never one to let a good crisis go to waste, took to his social media platform, Truth Social. The numbers, he declared, were "RIGGED" and a "major mistake". He singled out the BLS Commissioner, Dr. Erika McEntarfer, labeling her a "Biden Political Appointee" and accusing her, without a shred of evidence, of having "faked the Jobs Numbers before the Election to try and boost Kamala's chances of Victory". His directive was swift and unambiguous:
"I have directed my Team to fire this Biden Political Appointee, IMMEDIATELY".
The firing of a BLS commissioner over a bad jobs report was unprecedented, a shocking breach of the norms that insulate the government's data-gathering functions from raw political power. But it was also the explosive culmination of a year of mounting frustration and eroding trust. The BLS had been issuing massive downward revisions for months, including a colossal annual benchmark revision that erased over half a million jobs from the prior year. The public spectacle of the firing forces us to ask the questions that Wall Street and Washington are now whispering. Was Trump right, even if for the wrong reasons? Are the official numbers we use to make trillion-dollar decisions fundamentally broken? Is the person reading the thermometer the problem, or is the patient—the U.S. economy—secretly running a raging fever that the official instruments can no longer accurately measure? This report will seek to answer those questions.
Section 1: A Tale of Two Surveys (And the Productivity Paradox They Created)
To understand why the jobs report has become such a magnificent, market-moving train wreck, you first need a tour of the statistical sausage factory where it's made. Every month, the BLS releases two key pieces of data derived from two entirely different surveys. They are the main characters in our drama, and lately, they’ve been telling two very different stories.
The Statistical Sausage Factory
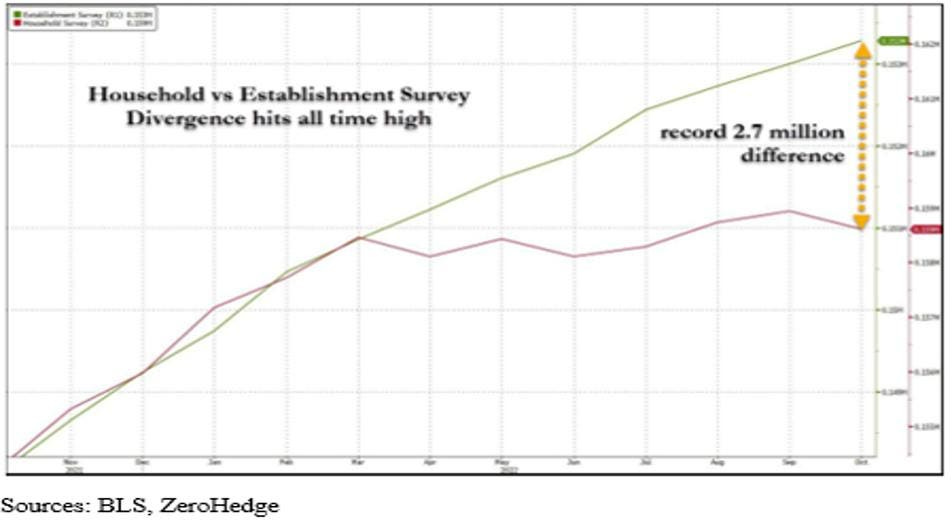
Our first character is the Current Employment Statistics (CES) survey, more commonly known as the "Establishment Survey" or the "Payroll Survey." This is the big one. It's a poll of about 121,000 businesses and government agencies, and it asks a simple question: how many people are on your payroll?. The answer to this question gives us the headline "nonfarm payrolls" number that everyone on financial television yells about.
Our second character is the Current Population Survey (CPS), or the "Household Survey." Instead of calling businesses, the Census Bureau, on behalf of the BLS, calls about 60,000 actual households and asks people about their work lives. This survey is used to calculate the official unemployment rate.
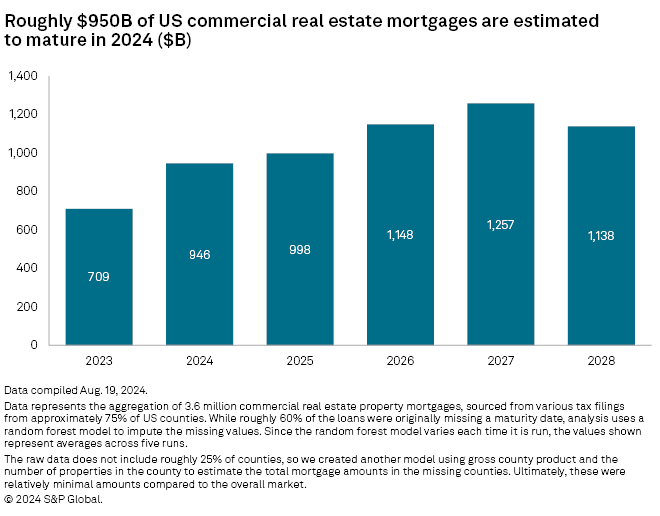
commercial real estate loan maturity wall 2025 chart
For decades, these two surveys, while measuring slightly different things, generally moved in tandem. They painted a coherent, if not always perfect, picture of the labor market. But starting around 2022, they began to diverge dramatically. It was like having two clocks, one of which is on Mars. The Establishment survey was screaming "Boom!" showing millions more jobs created than its household-based counterpart. This "Great Divergence" is the original sin behind the current data credibility crisis.
The Noise Before the Signal
While the divergence is a real problem, the monthly obsession with the headline number ignores a more fundamental statistical truth: the initial print is incredibly noisy. The BLS itself reports a 90-percent confidence interval for the monthly nonfarm payroll number on the order of +/- 136,000 jobs. This means that a reported gain of 73,000, like we saw in July, is statistically indistinguishable from a loss of 63,000 or a gain of 209,000. The market-moving "miss" was, in statistical terms, well within the normal margin of error.
The real story isn't the noise of one month's data; it's the signal from the persistent, one-directional nature of the revisions. The problem isn't that the numbers are revised; it's that they are almost always revised down, and by massive amounts. This points to a systemic flaw in the data collection and modeling process, a topic we will return to.
The Productivity Paradox
The most crucial insight, and the one most often missed in the political shouting match, is the mathematical consequence of these revisions. If we assume that GDP—our measure of economic output—is reasonably accurate, and we now know that job growth (the labor input) was significantly overstated, it leads to an unavoidable conclusion: labor productivity growth was significantly understated.
This isn't a theory; it's an arithmetic identity. Productivity is output per hour worked. If the numerator (output) was correct but the denominator (hours worked) was much lower than we thought, then productivity must have been much stronger. This single point reframes the entire economic debate. The story of the last year may not be one of a surprisingly resilient labor market, but one of a surprisingly, perhaps miraculously, productive one. The central question for the economy is no longer just "Are the jobs numbers fake?" but "Is this hidden productivity boom real and sustainable, or is it a dangerous illusion?"
To help navigate this statistical minefield, consider the following updated guide.
FeatureThe Establishment Survey (Payroll)The Household Survey (Unemployment Rate)Why You Should Care (The Snarky Translation)Who they ask121,000 businesses and government agencies who are probably tired of filling out forms.60,000 households who were unlucky enough to answer the phone.One is corporate spam, the other is a dinner-time interruption. Response rates for both are terrible.What they countJobs, jobs, jobs. Your barista's second gig as a dog walker counts!.People. Your barista only counts once, even if she's also a secret agent.The payroll number can be inflated by people taking on multiple part-time jobs to make ends meet.The Secret SauceThe spooky 'Birth/Death Model' that guesses how many smoothie shops opened and closed this month.'Population controls' that get a massive, confusing update once a year to account for immigration.Both surveys rely on statistical voodoo that has proven highly unreliable in the post-COVID economy.The Margin of ErrorSo large (+/- 136,000) that the monthly headline number is often statistically meaningless.Also significant (+/- 300,000 on the number of unemployed), making small ticks in the rate statistical noise.The numbers that move markets are often just random fluctuations within a wide margin of error.The Bottom LineThe number everyone yells about on TV.The number that shows the other number might be nonsense.The divergence between these two created the Productivity Paradox: weaker job growth implies stronger productivity growth.
Section 2: The Anatomy of a Firing
The weak jobs report and its shocking revisions were the kindling. The President's social media post was the match. The subsequent firing of BLS Commissioner Erika McEntarfer was the explosion, an event that ripped through the normally staid world of economic data and turned a statistical debate into a full-blown political crisis.
"You're Fired!": The Crime and the Punishment
The timeline was brutally efficient. The report dropped at 8:30 a.m. By midday, Trump was on Truth Social, laying out his case. The numbers were "RIGGED". McEntarfer was a "Biden Political Appointee" who had "faked the Jobs Numbers". The conclusion was simple: "She will be replaced with someone much more competent and qualified". Labor Secretary Lori Chavez-DeRemer, a Trump appointee, quickly fell in line, stating she supported the decision to "ensure the American People can trust the important and influential data coming from BLS".
The Victim's Resume
The caricature of McEntarfer as a partisan hack immediately crumbled under the slightest scrutiny. She was, in fact, a career PhD economist with a sterling, non-political reputation. She had spent over two decades in nonpartisan roles at the Census Bureau, the Treasury Department, and the White House Council of Economic Advisers. Most damningly for the "political appointee" narrative, she had been confirmed as BLS Commissioner in January 2024 by an overwhelming bipartisan Senate vote of 86-8. Among those voting to confirm her were figures who would later become key members of Trump's own administration.
The condemnation from the professional community was swift and universal. William Beach, the man who served as BLS commissioner under President Trump from 2019 to 2023, called his successor's firing "groundless" and warned that it "sets a dangerous precedent and undermines the statistical mission of the Bureau". Other former colleagues described her as someone who was relentlessly focused on data accuracy and who would push back on any attempts to put a political spin on her work.
The Chilling Effect and the "Data Integrity Risk Premium"
The long-term damage from this episode will far outlast the news cycle. The public firing of a scrupulous civil servant for reporting accurate but politically inconvenient data sends a chilling message to every other statistician and economist in the federal government: produce numbers the administration likes, or you could be next. This act politicizes the very process of data collection and threatens to destroy the trust in government statistics that is the bedrock of functioning capital markets.
Historical precedents from countries like Argentina and Greece show that once a government begins to systematically manipulate or discredit its own statistical agencies, it erodes investor confidence and can lead to a full-blown economic crisis. Markets can price almost any risk, but they cannot function without a shared set of facts. This episode introduces a new form of risk into U.S. assets: a "data integrity risk premium". Investors may begin to demand higher returns for holding U.S. stocks and bonds to compensate for the added uncertainty that the underlying data itself could be unreliable or subject to political whims. This effectively tightens financial conditions, acting as a tax on the entire economy, regardless of what the Federal Reserve does.
Section 3: A Tour of the Cracks: Is the Economy Secretly Terrible?
Now that we've established that the official jobs data is a hot mess, we must become our own economic detectives. If the government's primary labor market dashboard is flickering and unreliable, we need to look elsewhere for clues about the economy's true health. And when you start kicking the tires and looking under the hood, you find cracks. A lot of them.
The GDP Mirage and the Wobbly Consumer
In late July, the BEA released the second-quarter Gross Domestic Product (GDP) number. It came in at a headline-grabbing 3.0% annualized growth. The administration celebrated it as proof of a booming economy. But this was a statistical illusion, driven almost entirely by a massive, tariff-induced plunge in imports, which are a subtraction in the GDP calculation.
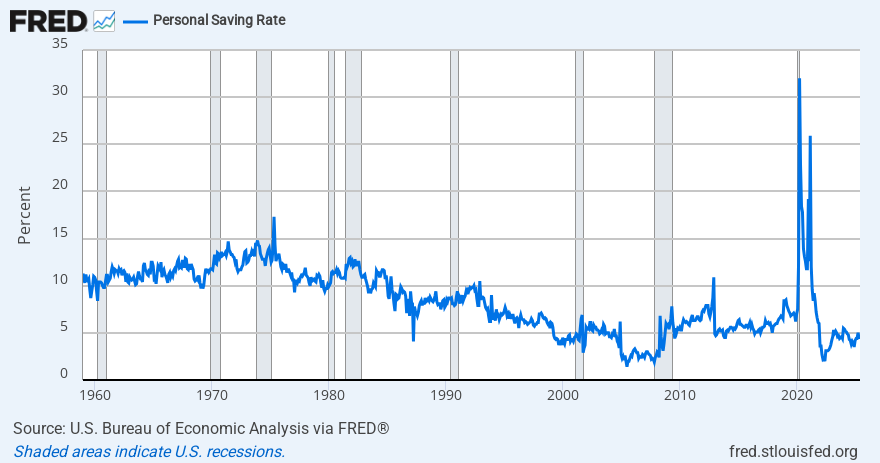
The real story was buried in the details. A core measure of the economy—real final sales to private domestic purchasers—slowed significantly to just 1.2% growth. Private investment plunged at a 15.6% annual rate, the steepest fall since the pandemic. This was the real economy, and it was weak. Meanwhile, the U.S. consumer, the economy's Atlas, is showing signs of strain. Spending growth is slowing, and the personal savings rate is hovering at a low 4.5%, suggesting that the capacity for future spending is limited.
Deep Dive into the Cracks
Beyond the headline numbers, several key sectors of the economy are showing signs of severe stress.
Commercial Real Estate (CRE): The Wall of Worry The commercial real estate market is not a crack; it's a chasm. An absolutely staggering $957 billion in commercial real estate loans are set to mature in 2025. These loans were largely underwritten in an era of near-zero interest rates and must now be refinanced at much higher rates. The office sector is ground zero, with vacancy rates near record highs of 14-20%. This threatens to trigger a wave of defaults, with office property delinquency rates potentially reaching 18%.
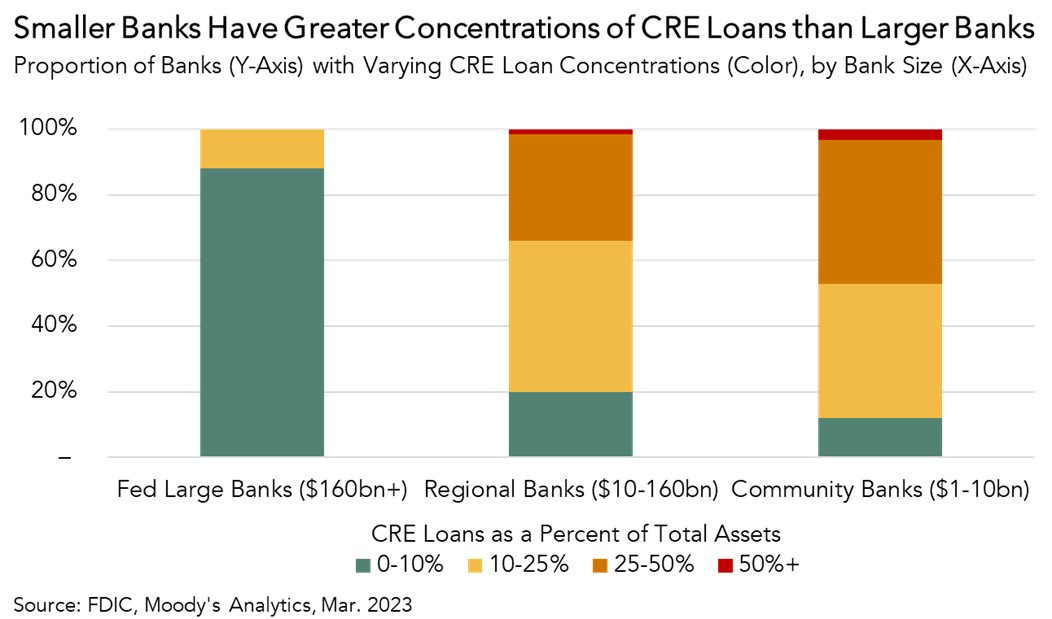
Regional Banks and the Small Business Squeeze So, who owns all of this ticking-time-bomb CRE debt? To a large extent, the nation's regional banks. Some mid-size and smaller regional banks have CRE exposure exceeding 300% of their equity capital—a level regulators view as excessive. While the largest banks are diversified, a wave of CRE defaults could severely wound these smaller lenders.
This creates a direct threat to Main Street. Small businesses disproportionately rely on these same regional and community banks for credit. As these banks face stress from their CRE portfolios, they are forced to tighten lending standards for everyone. For the fourteenth consecutive quarter, banks have reported tightening credit standards for small business loans, with loan demand and approval rates falling, particularly at smaller banks. This creates a credit crunch for the small businesses that are the engine of job creation, choking off growth at its source.
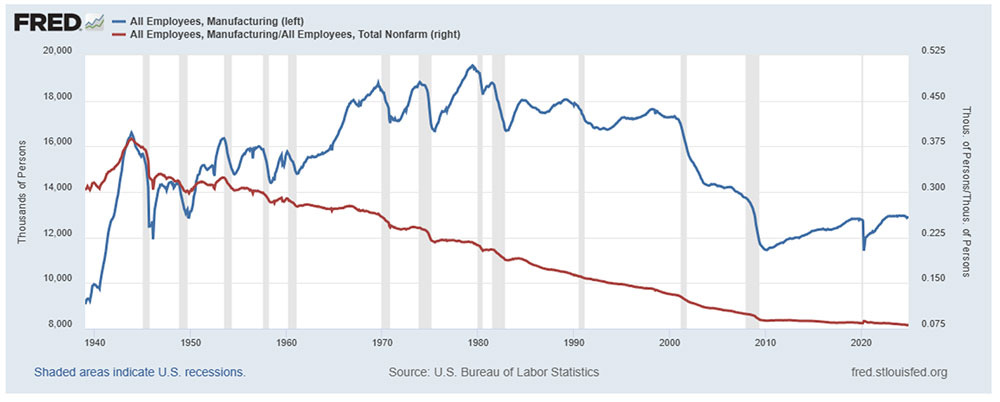
Manufacturing: The Tariff Boomerang The U.S. manufacturing sector shed jobs for three consecutive months leading into the August report, with 11,000 jobs lost in July alone. This is a clear failure of the administration's signature economic policy. Manufacturers are facing soaring raw material costs and crippling policy uncertainty from tariffs, which has caused them to pull back on hiring and investment. The tariffs, meant to be a shield, have instead acted as a boomerang, hitting the very sector they were meant to protect.
US personal savings rate FRED chart
Section 4: The Bull, The Bear, and The Productivity Paradox
With the official data now thoroughly discredited, we are left to choose between two plausible, competing narratives for the future. This choice hinges entirely on how one interprets the productivity paradox. Is the hidden productivity growth a sign of a structural, technology-driven miracle, or is it a cyclical, unsustainable illusion?
The Bull Thesis: The Structural Productivity Miracle
The bull case argues that the productivity surge is real, durable, and driven by a structural transformation of the economy.
The AI-Powered Boom: This thesis posits that the productivity gains are the first fruits of the AI revolution and other technological advances. Companies, having invested heavily in automation and digital transformation, are now able to produce more with fewer workers. This is a permanent, structural shift that will fuel non-inflationary growth for years to come.
Graceful Rebalancing: From this perspective, the labor market isn't collapsing; it's simply normalizing from an unsustainably hot, post-pandemic frenzy. The slowdown in hiring is a healthy rebalancing that will keep wage growth in check without tipping the economy into recession.
Unleashing the Animal Spirits: Bulls argue that the administration's aggressive focus on deregulation and tax cuts will overcome the headwinds from tariffs. This pro-business policy mix is expected to unleash a wave of corporate investment and confidence, creating a self-sustaining cycle of growth.
The Fed Put is Back: Finally, the weak (but flawed) jobs data forces the Federal Reserve's hand, making rate cuts a near certainty. These cuts will act as a powerful stimulant, reigniting economic activity.
The Bear Thesis: The Cyclical Productivity Illusion
The bear case argues that the observed productivity gains are a dangerous mirage—a temporary, cyclical phenomenon that masks deep structural weaknesses.
Layoffs and Labor Hoarding: This thesis argues the productivity gains are not from innovation, but from two less optimistic sources. First is "layoff-driven" productivity, where companies fire their least productive workers, mechanically raising the average output of those who remain. Second is "labor hoarding," where firms, reluctant to fire skilled workers in an uncertain environment, simply squeeze more work out of their existing staff. Neither is a source of sustainable long-term growth; they are signs of a deeply stressed system.
Policy Chaos Reigns: The single biggest risk is the erratic and internally contradictory nature of government policy. The clash between inflationary trade policy and the Fed's anti-inflationary monetary policy creates a paralyzing uncertainty for businesses, freezing investment and eroding confidence.
The Data Blackout: The politicization of the BLS creates a "data integrity risk premium" that raises the cost of capital for all U.S. assets. As trust in official statistics erodes, markets cannot function efficiently, leading to higher volatility and lower investment.
The Inflation Trap: The Federal Reserve is trapped. If it cuts rates to save the weakening economy, it risks entrenching tariff-driven inflation. If it holds rates tight, it risks pushing the fragile economy into a deep recession. The risk of a policy error is exceptionally high.
Conclusion & Investor Playbook: How to Bet When the Casino Is on Fire
After a deep dive into the statistical fog, political theater, and economic cracks of 2025, a verdict becomes clear. The bull case relies on a miraculous, structural productivity boom and a level of policy competence that is simply not in evidence. The bear thesis, grounded in the observable decay of our data infrastructure, the manifest chaos of our policy environment, and the tangible risks of a cyclical productivity illusion, is far more compelling. A major correction is not just a risk; it is the logical outcome of the current trajectory.
So, how does an investor navigate this treacherous landscape? Generic advice is inadequate. What is required is a thesis-driven playbook that positions for the most probable outcomes.
The Bear Portfolio (The Recommended Stance)
This portfolio is designed for the high-probability scenario of an economic correction driven by policy error and the revelation that recent productivity gains were illusory.
Asset Allocation: Overweight cash and short-term U.S. Treasury bills. Cash is not a zero-return asset; it is a call option on future volatility, allowing you to buy quality assets at distressed prices. Aggressively underweight broad U.S. equity exposure.
Equity Strategy: Focus relentlessly on "Quality" and "Defensive" factors: companies with fortress-like balance sheets, high free cash flow, and inelastic demand (consumer staples, non-discretionary healthcare, utilities).
Thematic Plays:
On-shoring & Industrial Automation: The one clear, long-term structural trend is the need for resilient supply chains. Invest in industrial automation, robotics, and logistics companies that will benefit as manufacturing is rebuilt closer to home.
Short Regional Banks: For investors with higher risk tolerance, expressing a negative view on the regional banking sector via inverse ETFs (like ProShares Short S&P Regional Banking, KRS) is a direct way to bet against the sector most exposed to the CRE downturn and the small business credit squeeze.
Sophisticated Hedging: Given the heightened "data integrity risk," traditional diversification may not be enough.
Volatility: Use periods of low volatility (VIX index below 20) to buy portfolio protection cheaply. Consider VIX-linked ETFs or ETNs to hedge against spikes in uncertainty.
Options: Employ strategies like purchasing protective puts on broad market indexes (like the SPX) or establishing "collars" (selling a call to finance the purchase of a put) to define and limit downside risk on core holdings.
The Bull Portfolio (For the Incurably Optimistic)
This is a higher-risk strategy that bets the productivity boom is a real, structural, AI-driven phenomenon.
Asset Allocation: Lean into risk. Buy the dip in cyclical sectors beaten down by recession fears, such as industrials, materials, and financials.
Thematic Plays:
Regional Banks: If the soft landing occurs, regional banks are deeply undervalued and would benefit from a steeper yield curve and a surge in M&A. Leveraged bull ETFs (like Direxion Daily Regional Banks Bull 3X, DPST) offer an aggressive way to play this thesis.
Productivity & AI: The long-term productivity story is real. Continue to invest in the large-cap technology platforms at the forefront of the AI revolution.
The "We Don't Know Anything" Portfolio (A Nod to Utter Cynicism)
This portfolio is for the investor who concludes that the only rational stance is one of profound humility and maximum diversification against institutional decay.
Asset Allocation: If the United States is the epicenter of the policy and data integrity risk, then be somewhere else. Systematically underweight U.S. assets and overweight international developed and emerging market equities.
Hard Assets: In a world where faith in government institutions is eroding, hard assets become more attractive. A meaningful allocation to gold serves as a hedge against both inflation and a potential crisis of confidence in fiat currencies.
Final Word: When the official scorekeepers are being fired for reporting the score, the only prudent assumption is that the game is more random and dangerous than ever. The safest bet may be to acknowledge the chaos, protect your capital, and wait for the fire to burn itself out.
Good luck!